
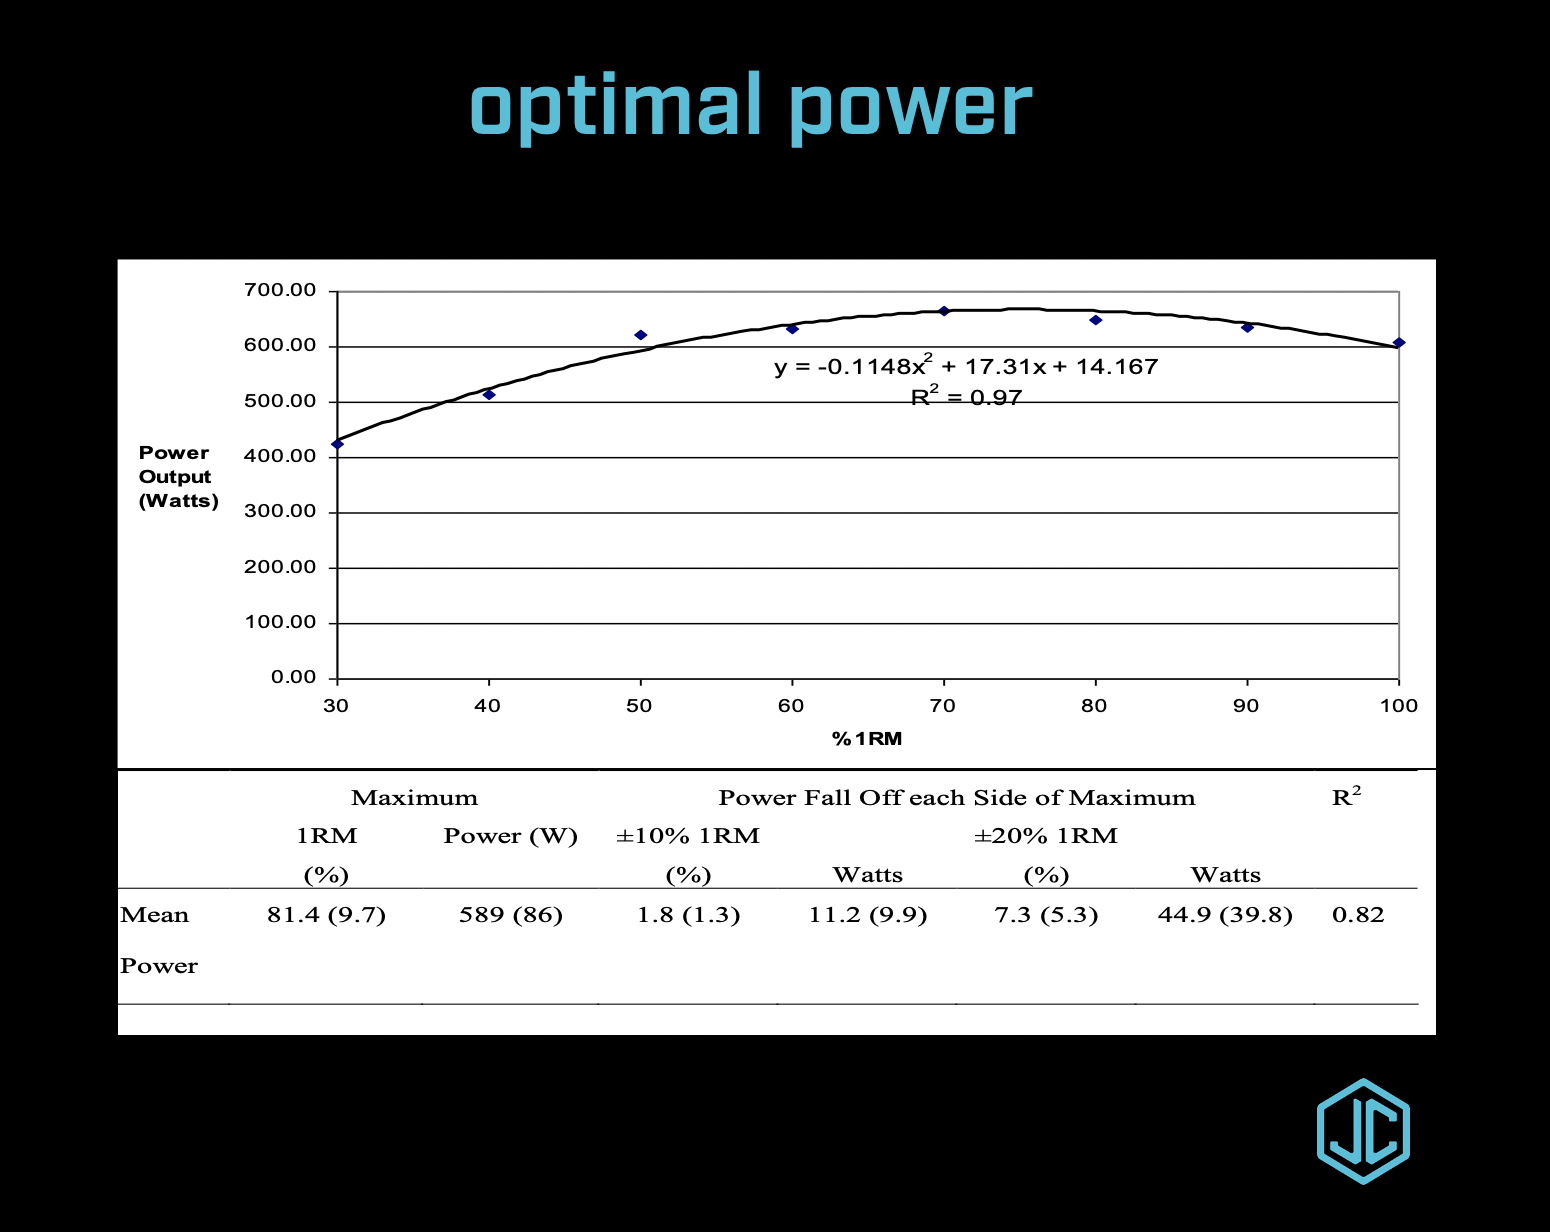
Making much sense of the graph? In a previous musing "Effects of rebound, ballistics and load on power output" I showed some power outputs (PO) from a bench press where the load that optimised PO was around 60% 1RM regardless of technique. The data on this graph is for a seated row of Olympic rowers.
What are you seeing?
· The load that optimised PO was ~81% 1RM.
· When you fit a curve, there looks very little difference between 50 to 100% %1RM.
· In fact, if you go 10% 1RM either side of the 81%1RM, there is only a 1.8% change in PO.
· If you go ~20% 1RM either side of the load that optimised PO, there is only a 7.3% change in PO.
Take home messages.
· Power profiles and the load that optimises PO will be movement (e.g., bench press and seated row) and sport/athlete specific.
· Finding the load that optimises PO, and training using that loading, may not be good use of time given the plateau effect observed in the Olympic rowers.
· Training using a bandwidth approach and bringing in variability – (speed strength-strength speed) may be a better approach.
JC Online provides online physical conditioning education for physiotherapists, strength and conditioning coaches and physical therapists. If you have any questions about our courses and other resources, please get in contact with us using the email above.
Please note that answers to many questions may be found in the FAQ section of this website. JC will endeavour to answer your questions but due to his work commitments and the high volume of emails received each day, he may be unable to respond to every email personally.
JC's team will coordinate and may respond on his behalf.